Wednesday, 30 December 2009

Mexican flu vaccine campaign; a false positive?


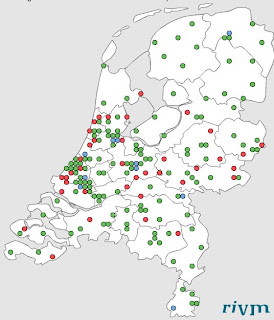
Great news this week, the Mexican flu epidemic is officially over in the Netherlands. In July of this year, the first cases of Mexican flu were reported. At that time the World Health Organisation (WHO) already had signalled that the danger of a flu pandemic was growing and every country was advised to take appropriate counter measures. One in every 3 persons would get infected if no counter measures were taken. In the Netherlands this lead to the “Grip op Griep” campaign informing people on how to reduce the chances of getting infected. With silly posters people were told how to sneeze and to disinfect their hands, reducing the chance of infection. Also people having symptoms of the Mexican flu were tested and if required vaccinated. Later on this was turned into a countrywide vaccination campaign for the elderly and the young. In the Netherlands, until this week, 51 people have died, 2168 people were hospitalized and 4 million people have been vaccinated. The vaccination alone costs around 300 million euros. When comparing the numbers of infected with the previous years, (see http://influenzanet.com/) you can question whether it was all worth the fuzz. You will see that the number of infections from Mexican flu is highly overestimated. Also the cost effectiveness of the campaign is questionable. Can’t this be improved with a little more analytical approach?

One of the things that could be improved is the level of understanding doctors have on risks and probability. A test by Deborah Bennett on the ability of doctors to interpret test results shows this. In the test a doctor is asked to estimate the probability that a patient will have a disease, given a positive test result. The doctor knows that the disease will strike once in every thousand people. Also the test used presents a rate of 5% false positives. People are tested at random, regardless of whether they are suspected of having the disease. What is the probability of the patient having the disease? Most doctors will say 95%, but this is highly overestimated. What did you think?

To get the correct answer use the fact that out of every thousand people who receive the test, one will have the disease and 999 will not. Anyone who actually has the disease gets a positive result, so no false negatives (this is complicated enough for the doctor, but if you like the challenge assume a detection efficiency of 80%). One out of every thousand tests is a true positive. The remaining 999 tests should have negative results, but 49.95 of these tests will also give positive result (the 5% false positive rate). So in summary we have 50.95 positive results in every 1000, but only one of these is a true positive. So one in every 50.95 positive tests identifies a person who actually has the disease, or 2%! Believe it or not, we just applied the Bayes theorem!


P(Ill given Positive) = P(Positive given Ill) * P(Ill)/P(Positive) = 100%*0.1%/5.1% = 2%. Note the dramatic effect on cost if the test results are interpreted the wrong way. It will lead to unnecessary treatment of 50 people in every 1000. 51 times more budget is spent than required, assuming that the 50 false positive patients do not exhibit negative effects as a result of their treatment that require further medical. With this in mind, you can question whether the decision to vaccinate 4 million people is a good one. Recent research from the Groningen University (See Robin de Vries) shows that the current models to estimate cost and effectiveness of preventive vaccination by the Dutch government need improvement. I am convinced that more and better applied analytics will help.


Note : Back to the Bayes Theorem. Just a few days ago a terrorist tried to blow up a plane flying from Amsterdam to Detroit. Questions were raised on the effectiveness of the intelligence agencies trying to identify terrorists. Surly this attack was a false negative in terms of testing. It is interesting to figure out what should be the effectiveness (low false negative rate) of a test applied to identify a terrorist with a high level of reliability, certainly in relation to the level of false positives this test might generate.

Friday, 27 November 2009

Your buying habits revealed!

You probably do not even think about it when you pay at the checkout counter of your local retailer, but retailers have been collecting massive amounts of data on your shopping for several years now. Ahold alone has registered 32 billion ticket lines over the past 7 years; every week 80 million ticket lines are added to that. That mountain of data has been collecting dust over the past few years. Mathematical modelling, statistical techniques and computer power have given the retailer the tools to mine for gold. But are they making the most of it?

Recently I was invited by the VARA, a Dutch broadcasting company, to explain how retailers use our shopping data. While at the future store of Metro in Germany I was interviewed on the subject. The interview was part of the “Weet wat je koopt” programme. The programme’s objective is to scientifically explain the background of certain products, like night vision glasses or Mexican flu vaccines. A perfect setting to explain how mathematics support retailers and show some of the stuff Stephen Baker has written about in practice. You can see the result on “Uitzending gemist

Retailing really is paradise for Operations research professionals. With the data from consumer transactions, point of sales scanners, customer loyalty cards, website click through streams, RFID tags and smart carts (that register the way you walk through the store) quality data is absolutely no issue. That data allows us to help retailers to find the most efficient replenishment strategy, sourcing, and optimise on stock levels in both the store and at the distribution centre. But there is more. Assortment planning for example was previously an area where no optimisation methods were applied. It was seen as an art or craftsmanship from the store manager to find the best set of products for the store. From actual sales data, a store manager can learn from the buying habits of the customers to find the best assortment, making it a more fact based decision.

What is next? Well think about the actual lay out of the shelves. Don’t you ever wonder why certain products are displayed on eye level? You bet that it will influence the sales. Research has shown we buy more products on eye level than other. Knowing this, the retailer has to be smart on how to display his products, making sure that products with the highest margin are on eye level. Extending this a bit, knowing how customers move through the store can increase the effectiveness of product display even more. In the future store this was even extended a bit. With the “Einkaufsassistent” (an application on your cell phone) it is possible to direct you to the exact location of a product on your shopping list.

With all the knowledge on our buying habits, the retailer can try to tailor his offering to our preferences. In the old days the grocer around the corner already did this, like the milkman. With the massive stores, we have become unknowns to the store manager. Using the knowledge from our buying habits they can build up that knowledge again. Not that they want to know us personally, they are only interested in our buying habits. With that knowledge they can target us with special offers (like Tesco does in the US) or surprise us with an text message on our cell phone when we enter the store stating whether we forgot the peanut butter on the shopping list.

Sunday, 25 October 2009

Go GREEN!


Last week I had a presentation at the ORTEC user conference, together with one of my friends form the Antwerp University, Patrick Schittekat. Also Walther Ploos van Amstel was there with a nice speech on the diminishing elasticity in logistics. Our subject was on how to be green from an environmental perspective but still be competitive. We state that instead of waiting for the governments to come up with measures to reduce emissions, companies should re-think their supply chain now. That way companies can turn going green from a liability into an asset and are well prepared for the future. This doesn’t have to be a jump into the dark when it is fact based and with analytical support.

The speech we held was a result from the corporation between the Antwerp University and ORTEC as part of the Optimising the World initiative of ORTEC. We started this initiative this year and it contains 4 main themes; Humanity, Environment, Education and Sports. I already explained the Humanity programme in one of my earlier blog entries; see for example the entry on the Uganda flood response. In Education we try to stimulate students to choose mathematics, applied mathematics, econometrics and so on. For example by sponsoring the International Math Olympiad, this is held in Amsterdam in 2011.

Back to our speech, you can find the slides on LinkedIn by the way. Our story starts in Portugal, where Patrick had his holidays. During one of his trips he ended up in an orchard full of orange trees. He is quite surprised to hear that this is probably the only way to eat real Portuguese oranges in Portugal. The oranges in the stores in Portugal are from Turkey! Can you imagine that? It’s cheaper to grow oranges in Turkey and transport them all the way to Portugal than to grow them in Portugal in the first place. This is not very optimal from a green perspective. This will probably change when emission taxes are introduced, as will be the case at the Copenhagen conference later this year. This tax will influence all the logistics in any supply chain. The decision that any company must make is to either endure this tax or start acting now. Many times going green means increasing costs; one has to invest in new technology to have lower emissions. But that is not always the case. During our speech Patrick and I gave several examples in which environmental friendly changes and cost savings go hand in hand.

A straightforward example is the optimisation of the logistics operation, minimizing number of deployed vehicles and kilometres driven. Since a truck on average emits 0.9 kg C02 per kilometre, every saved kilometre leads to a greener operation. But more is possible, for example by changing the modalities used. In one of the projects I was involved in, the supply chain for an electronics company required restructuring. Many of the products they sold were produced in China. Transportation of the products was therefore something to think about. The products can be shipped to Europe by sea or air. Air is expensive and fast and not very green per kg transported. Sea is cheap, has low emission per kg transported but is a bit slow. Transporting products by sea takes a couple of weeks, while using air the products could be at the shops in 2-3 days. The price of the products sold can fluctuate a lot; a long lead time can therefore mean a substantial loss of revenue. How than make the trade-off between sea and air?


What we did is build a supply chain model (using the AIMMS solution) in which we were able to optimise and evaluate different kind of set ups for the complete supply chain, focussing on service (is the product on time at the point of sale), cost (air is expensive!) and CO2 emission (what is the environmental burden of the scenario). The model enabled us to create insight into the dynamics of the supply chain, supporting the management in making their trade-off between air and sea and the environment. In the end the best set up was a combination of the two modalities. In acting this way, the company is well prepared when the CO2 emission taxes are introduced, and ahead of competition. They made going green there asset, not a liability.

Saturday, 26 September 2009

What about Risk?

One of the hot topics in the Dutch news these weeks is the financial disaster the construction of a metro line in Amsterdam is causing. A quantative based risk assessment would have lead to better estimation of the financial risks upfront and better risk mitigation strategies during the project.

At the start of the project the total investment for the metro line was estimated to be €430 million. Based on this estimation the Amsterdam council decided to go ahead with the plan. Besides the relief the metro would bring to the dense traffic in the centre of the city, making it more healthier to live in, it would also make the centre of the city more appealing. No walls of trams blocking your view of Amsterdam. Constructing the metro would take some time and would cause a lot of inconvenience during that period. By the end of 2011 all work would have been done and everybody, either citizen or tourist, would benefit from fast and comfortable transport under the city. The actual situation is much different. Cost are now estimated to sum up to €3.1 billion (that’s more than 7 times the initial estimate!) and the project will finish no sooner than 2017.

These things can happen of course, but all big infrastructural projects in the Netherlands seem to go this way. To name a few, the construction of a high speed railway track is over budget, delayed and still not operational. A new railway track for freight trains towards Germany is operational, cost more than estimated and has a lower than estimated utilization, making it less profitable. And yesterday the construction of the new campus of the university of Maastricht was stopped, because of excessive cost overruns. What questions me is, didn’t the decision makers in each of these projects ever hear of quantitative risk management?

The project plan for the Amsterdam metro included a risk analysis both financially and technically. The tubes of the metro and the underground stations need to be constructed in very wet grounds. Many of the old houses are build on wooden poles and digging deep holes near them might case damages to the houses. Past experience and even tests had shown the construction workers how to deal with it. The total addition for risk in the budget was set to 4%. This number really makes me laugh. When I compare that risk measure with the risk measure normally taken into account in for example IT developments (10%) that would mean that constructing the new Amsterdam metro is far less risky that making a IT system. Is this really true?

The trouble with risk is than we can perfectly look back and see the cause and effect relationship of every incident, but how to asses or even forecast consequences of risks? As Nassim Taleb already described we (as humans) are not capable of dealing with probability. We tend to underestimate the bad (see the financial crisis) and overestimate the positive risks (we all think we will win the €27.5 million price in next months lottery). So we need some help to deal with it. I don not mean the simple risk mapping tools that were probably used in the assessing risks of the above disasters. These methods are not fit for assigning risks, it is far better to use quantative models. It has been shown (see for example the work of Fiona MacMillan in assessing risks in oil exploration) that companies using quantitative risk methods have a better financial performance, this should also hold for (local) governments.

One of the methods that I use a lot is Monte Carlo simulation. It is flexible, pretty straightforward to program and very easy to use. I used it to asses risks for pension funds and insurers and to identify robust strategies in for example investments. I also used to calculate dredging lanes. In one of the projects for insurers I used is to asses the financial risks involved when a catastrophe, like a hurricane or flood, occurred to oil rigs or refineries. That last example is comparable to the construction projects mentioned above.

How come nobody in government uses these methods? It will probably save us all a lot of money and probably also some careers in politics. I think it should be part of legislation. No new big infrastructural project should be started with a certified and quantative risk assessment, using state of the art models.

Wednesday, 19 August 2009

Strategic value of OR

In the CPMS group of INFORMS on LinkedIn a discussion was started on the contribution Operations Research can have in Strategic Planning. This discussion triggered me to think about if and when Operations Research offers added value in boardroom decision making. You might think that because the name of our profession starts with Operations, that it is the only area of business where it can be applied. My experience is different.

This year’s winner of the Edelman award is a perfect example of how OR can support Strategic Planning. HP has used Operations Research to transform their complete product portfolio and saved $500 million over a three year period. The challenges faced by HP were huge. HP had tens of thousands of products in over 170 countries. By applying OR techniques HP has redesigned their complete supply chain and improved on profitability and agility.

From my own experience I can give several examples in which OR plays a crucial role in boardroom decision making. One of them is the Global Optimisation programme of TNT Express. The programme objective is to enable the strategic goal of TNT Express, focus in networks. TNT Express has identified that using OR supplies them with a competitive advantage. Using OR models we created insight on the strengths and weaknesses of the current network and service offerings of TNT. With this knowledge and in cooperation with senior management future scenarios were formulated based on which new network designs and service offerings were identified. With these results senior management of TNT Express is able to achieve $M cost savings for the short term and make fact based strategic decisions on future network design and service offerings.

TNT is not the only example. Other examples of the application of OR within strategic decision making are optimised pricing strategies in the airline and travel industry and the identification of the contribution, investment and indexation policies for pension funds and insurers. In each of the examples OR is applied first to understand the dynamics of the arena in which the decision needs to be made, leading to a mathematical model that provides the insight. Than the model is used to identify and evaluate possible alternatives (= scenario’s) and decide on the best way forward (=strategy/policy). How the alternatives are constructed or generated very much depends on the type of questions that need to be answered. This also applies to the environment in which the decision is made. In many cases, because nobody can predict the future, Monte Carlo simulation is used to generate viable future scenario’s based on which the most robust future strategy is identified.

More and more companies use OR as part of their strategic decision making. But there is still much ground to cover for us as OR professionals. To “compete on analytics” companies need to better understand what OR can offer them, but also its limitations. OR is no magic lamp or crystal bowl offering the answer to any strategic question. The responsibility for the decisions on strategy lies with senior management, OR can help them unravel complexity, quantify risks, understand consequences of decisions and in the end beat competition.

Monday, 25 May 2009

Does Operations Research sell?


No, it does not; nobody is looking for an Operations Research specialist. What companies seek is a solution, not a tool or skill. We will have to convince them that Operations Research can lead them to a solution. In the current climate of economic downturn companies seek strategies to survive. They have many questions like how to cut costs, improve profitability or want to review their total supply chain. Questions that require the support of Operations Research to solve them. Although companies need support, it does not imply that it is easy to get a new project. There is no standard “algorithm” that gives you a new project every time you run it. Acquiring a new project can be hard and it requires skill that can not be learned form a textbook. Here are some of my experiences.

Create Some Buzz
First step in acquiring a new project obviously is to get an appointment. When you are very lucky you get a call and are invited to have a talk about the questions that need to be addressed. But unfortunately this is often not the case. Before you are invited to have a talk and possibly acquire a new project, you need to get yourself noticed or get introduced. To accomplish that you need to make some buzz about your work and achievements in the media that your customers are most likely to read. Think about business magazines, blogs, websites, speeches at conferences, etc. The most effective way is to ask your customers to make the buzz. For example by means of a short statement on the project you performed for them and what you have achieved. Do not forget to let them include a statement on the project cost and the cost reduction or increased revenue you have accomplished. Getting noticed also requires you to build up a network, which enables you to get introduced to the right people. Moreover since your customers are happy with the result of the project, you can ask them to help you find new projects.

Golden Nuggets
Operations Research is a relative young area of expertise. Although it has been around for over 60 years now, we as OR professionals still need to carefully explain what OR has to offer. Managers many times mistake OR for some kind of application of IT. Operations Research requires IT as an enabler very often, like in Advanced Planning Software or as part of a larger ERP system like SAP, but it surely is not the same. It is far more than that. During the acquisition phase of the project we therefore have to explain in non technical terms what can be achieved with OR, preferably in terms used by the potential customer and with examples from the business area of the potential customer. The examples should come from your own (or your colleagues) experience, like the testimonials from your customers. These golden nuggets will provide you with some ease of mind during your conversation, while the potential customer will be amazed by the things that can be achieved with OR.

Cherish your customer
So creating Buzz and some nuggets is enough? No, but they help a lot. The far easiest way to get a new project is at your current customers. It is a rule that applies to any business; it sure does apply to ours. Your current customer knows you and knows what you can achieve for him. So make sure to do your best during your current projects. If it is successful, acquiring the next project will be as easy as picking up the phone. Operations Research sells after all!

Sunday, 19 April 2009

Hip Hip Hooray!

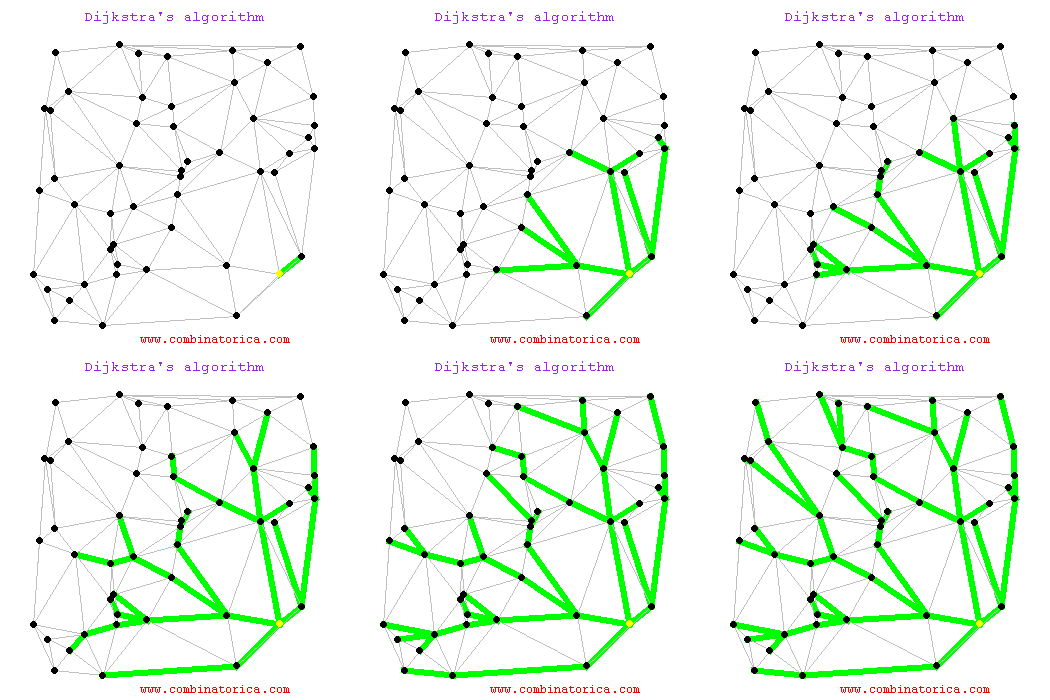
This year it has been 50 years since a Dutch Mathematician Edsger W. Dijkstra published his famous algorithm to solve the shortest path problem. Time for a celebration! Although not always visible, we depend on the algorithm every day. The algorithm has many examples, starting from the obvious application in the satellite navigation system in your car. But also less straight forward applications like in Internet routing protocols like IS-IS and OSPF, without it no Internet and you would not be able to read this blog entry.

Edsger Dijkstra was a brilliant computer scientist, who strang enough was not very found of using computers himself. He was well known for his use of a fountain pen, instead of a word processor. It has been said that he even went so far as to create his own ink because he was not happy with the quality of the ink that was available. Besides the Shortest Path algorithm he has many other accomplishments in the area of program correctness, mathematical methodology, algorithms, and systems. He considered the GOTO statement as disastrous as you can read from his article in the Communications of the ACM 11, 147-148 in 1968.


"For a number of years I have been familiar with the observation that the quality of programmers is a decreasing function of the density of go to statements in the programs they produce. More recently I discovered why the use of the go to statement has such disastrous effects, and I became convinced that the go to statement should be abolished from all "higher level" programming languages."

Dijkstra’s algorithm is a greedy algorithm to find the shortest distance from a starting point (or vertex) to any other point in a network (or graph). Actually it is an undirected weighted graph, the edges (or lines between points) all have a value, for example cost or duration. I have used it many times, even programmed in VB using GOTO statements (sorry Edsger!). It is any easy to use algorithm, and simple to programme or adapt to specific applications. It should be part of any OR practitioners toolbox. The obvious application is to calculate the travel times and shortest distances in a network. Based on the result infrastructure analysis and network design studies can be performed or optimal routes can be calculated. But I also used the same algorithm to generate schedules for bus drivers.

Dijkstra’s algorithm has many real world applications. One of them is in telephone networks. In a telephone network the lines have bandwidth; a phone call needs to be routed through the network via the highest BW. By representing the switching stations as vertices and the transmission lines as edges and the weight of edges to represent the band width, with Dijkstra’s algorithm we are able to find the best routing. This example is similar to the situation in which you want to plan your holiday or business visit. Given the available flights, airports and arrival and departure times, you can find out the earliest arrival time at your destination given the airport you want to start form and the start time with Dijkstra.

With Dijkstra’s algorithm we can put Operations Research into practice! Therefore three cheers for Edsger, Hip Hip Hooray, Hip Hip Hooray, Hip Hip Hooray!

Saturday, 21 March 2009

SiCKO

In the past few weeks the Dutch hospitals were in the news several times. The hospitals in the Flevopolder (IJsselmeer hospitals) went broke and have now been taken over by an investment company. In Zeeland negotiations to merge two hospitals were stopped. In Limburg one of the 3 hospitals in that area nearly went broke because of financial mismanagement, now over 600 nurses may lose their job. Seems that healthcare itself should go for a check up. When looking at the number and geographic spread of hospitals in the Netherlands, I wondered if we don’t have too many of them. Researching some statistics, this hunch seems to be right. Over 70% of the Dutch population can reach a hospital within 20 minutes, which is 22% above the EU average. Also the average distance to a hospital in the Netherlands is only 7 kilometres. We can do with fewer hospitals and still be well within the safety limits.

People in the US are less fortunate with respect to healthcare. 20% of the US population lives in areas with only 9% of the doctors. Moreover the cost of healthcare is 2.5 times the cost of OECD countries and continues to rise. So people in the US get less care at a higher price. More than 50 million people of the US lack insurance and as a consequence do not receive treatment when required; even Medicaid patients sometimes are not accepted. Access to healthcare can be an issue when you live in the US. Michel Moore can tell you all about it.

How to address such a challenge then? The Dutch and US situation with respect to access to hospital care is comparable to a location decision similar to the decision on where to place antennas to set up a UMTS network. The hospitals need to be located in such a way that the longest travel time of a patient is within the safety access time. The safety access time is different for emergency care than for example paediatric care, so different care types require different service times. Besides access time also the demographic characteristics of the population should be taken into account. The demographic characteristics determine the kind and demand for healthcare, elderly people usually demand more and specialised care. To give you a flavour, 80% of the cost of your life time healthcare is generated in the last 5 years of your life. Most of it is hospital care. More demand for healthcare means more doctors and beds and therefore a larger location. As such, the hospital location decision looks very much like the facility location problem, a problem that we know how to solve.

Decisions on location, size and kinds of healthcare offered are political decisions. With the use of techniques from the area Operations Research better and more objective decisions can be made on number, size and location. This will lower the cost for healthcare or enabling more care for the same Euro/Dollar. That is not the only subject were Operations Research has added value in healthcare, to name a few:

  • Improve on the allocation of drugs
  • Improve on the efficiency of the distribution of vaccines, redesign of vaccine programmes
  • Improve blood supply chain
  • Reduce organ transplants that go to waste.
  • Improved budget allocation, use the available money better
  • Better allocation of medical personnel; geographic spread, better schedules, improve productivity.
  • Improvement on the screening programmes; early disease detection like certain cancers.

I all of these areas good work has been done, but to my opinion not known to the decision makers in healthcare. I would to invite them to read about it and to challenge us, the Operations Research practitioners, to come up with a challenge that we can not help to solve.

Friday, 6 February 2009

Excellence in Industry


Yesterday I was at the 23rd Belgian Conference on Operations Research (http://www.orbel09.be/). It was hosted by the University of Leuven in the ancient city of Leuven, a wonderful setting for such a conference at wich also Martin Grötschel and Maurice Queryanne were present as plenary speakers. I really recommend you to visit Leuven, even if you have little time available. A very good way to plan for such a trip is to use http://www.citytripplanner.com/ .

I was in Leuven as a member of the committee for the Excellence in Industry award that is sponsored by the company I work for, ORTEC. For the award 6 projects were nominated. Each submitted project was asked to present the project in a 20 minute speech. Since the award is about Excellence in Industry criteria such a business relevance and practicality of the solution were very important in evaluating each of the submitted projects. But than again, that is what Operations research is about, improve and enhance operations.

The winner of the award was the integrated berth allocation and crane assignment model of Rowan van Schaeren. In his project he succeeded to combine the berth allocation and the quay crane planning for a container terminal in the Antwerp harbour. The combination of the two is unique, but more important, the model was applied in practice in such a way that the container terminal is able to lessen the time required for a ship to spend at the terminal. It therefore saves money. Second, the model also assists the planners of the terminal in creating a plan, reducing their effort. Before the model was available, the berth allocation and crane assignment was done manually and separate from each other. Getting a feasible plan was a first priority. With the model in place, the planners can now focus on the quality of the plans and also better manage the cost of manpower on the terminal. This is what Operations research is about, improving Operations!

The runner up for the award actually was the project that resulted in the city trip planner I mentioned above. It also is a wonderful and very practical application of Operations Research; it even works on a smart phone. The idea was born out of a need of tourists to select locations in Leuven that they could visit given their available time. Leuven has many points of interest (around 170) that make it impossible to visit them all in a short time (say a weekend or a day trip). To help the tourist decide on which points of interest to visit a website was developed, with behind it a model to support the tourist in planning the city trip. On the website you can fill in a short questionnaire on the kind of points of interest you would like to visit and your available time. What is interesting is that questionnaire also asks you to add keywords on subjects or general interests you have. These keywords are used to query the descriptions of the points of interest to select the best matches. Based on the scores of each point of interest, the travel time between each of the points, expected length of stay and the available time for the trip, a plan is suggested including a route which you can print or download on your cell phone. Again a very practical application of Operations Research.

Given the possibilities Google offers in real time tracking of cell phones I can imagine that extending the city trip model to reduce queuing at popular sites or even using the length of stay at each location to better estimate trip length is easy. Not to mention the possibility to have the model order your beer in advance, so it’s waiting for you when you arrive at the end of your city trip. Not sure if I would like that.

Wednesday, 28 January 2009

From Politics to Maintenance


On my way to the office I listened to an interview on the radio. The reporter was interviewing the project manager of the largest infrastructural building site in the Netherlands, the construction of the orbital motorway around Eindhoven. The project manager indicated that the project would take 4 years. During that time the current traffic, around 150.000 vehicles per day, needs to by-pass Eindhoven using temporary roads. During the project these temporary roads will change constantly. Today nearly every driver in the Netherlands has a TomTom kind of navigation system in the car, which is trusted without question on directing the user to its end destination. These systems are a very good example of how practical Operations Research can be. The situation around Eindhoven however changes every few weeks, which causes some of the drivers that blindly follow the directions from their navigation system to end up between the builders. A good example that even though you have a wonderful system available to solve an optimization problem, you still need to be aware of the conditions under which you apply it. At least some of the drivers around Eindhoven know that now.

The interview on the radio also brings back some projects that I did in the past with respect to road construction, that are nice examples of how broad the application of Operations Research can be. To start with, in the Netherlands the Ministry of Transport, Public Works and Water Management is responsible for the maintenance and construction of roads. They develop a long term plan in which specific projects are scheduled to either construct, changes of maintain roads. Based on that long term plan, a yearly budget is determined that is announced on the annual speech of the Throne on the third Tuesday of September. The challenge in developing the long term plan is that projects usually take longer than 1 year, and in each year a certain budget is required. The budget approval from the House of Commons however is for one year only. Also the scheduled projects cannot be stopped as soon as they have started, and as you can imagine, some of the projects take more time and therefore more money. Also the projects are related and have precedence relations. Every year the long term plans needs to be reviewed and revised to come up with a new annual budget. The number of projects is quite large, so manual adjustment is out of the question. This is where Operations Research comes in. Actually, the problem the Ministry of Transport, Public Works and Water Management faces is a capital budgeting question which we solved using a linear programming model. With this model the Ministry was able to decide which projects to start or postpone and so meet the budget requirements, but also have the projects with the highest priority scheduled as soon as possible. The model supported the Ministry to objectify the project scheduling, making it a less political decision. Maybe they should use Operations Research more for example better estimate the risks involved in large infrastructural projects.

On the other side of the spectrum, I was also involved in a project in which the objective was to find the cost optimal strategy to maintain road section. The cost identified was used for the above budgeting process but also to compare it with the offers submitted by the road construction companies that would like to get the maintenance contract. So Operations Research enabled a sanity check on the offers done by the road construction companies. With the optimal maintenance strategy available, the government was able to challenge the construction companies, leading to more efficient road maintenance at a lower cost. Finding the optimal maintenance strategy was a challenge in itself. Based on actual the road conditions (holes, bumps, wear and tear) the model we developed was able to define the best maintenance strategy for each part of the road. We accomplished that by dividing the road into (virtual) tiles en for each tile decide to either lower it (scraping of the tarmac) or raise it (put on tarmac). Using a dynamic programming formulation the optimal maintenance strategy was identified, taking restrictions on bumpiness of the road, angle, etc, into account.

So Operations Research can be very hands-on giving you an exact plan on how to maintain a road segment and helps to identify the best maintenance offer. On the other hand it also supports decisions on governmental level, making the difference between what’s logical and politics.